Account managers and technical support teams spend a lot of time giving customers advice: try this feature, restructure that campaign, fix this setting. Everyone believes it helps. Proving it is another matter.
This post is about how we measured the impact of that work for a large online advertising platform. Advertisers who received proactive advice from technical account managers and technical services teams were compared with advertisers who didn’t, on the metrics that matter to both sides: impressions, clicks, click-through rate, cost per click, spend and revenue.
Why “before and after” isn’t enough
The obvious approach is to compare a customer’s spend before and after the engagement. The problem is that everything else moves too: seasonality, market trends, product changes, the customer’s own plans. If spend went up 15% after a call, was that the advice, or was it December?
What you really want to know is the counterfactual: what would this customer have done without the engagement? You can’t observe that directly, so you have to construct it.
Synthetic controls in one picture
The synthetic control method, from the causal inference literature, builds that counterfactual from data. For each engaged customer, it searches a pool of similar customers who were not engaged and finds a weighted combination of them whose history tracks the engaged customer as closely as possible before the engagement. That weighted blend is the synthetic control.
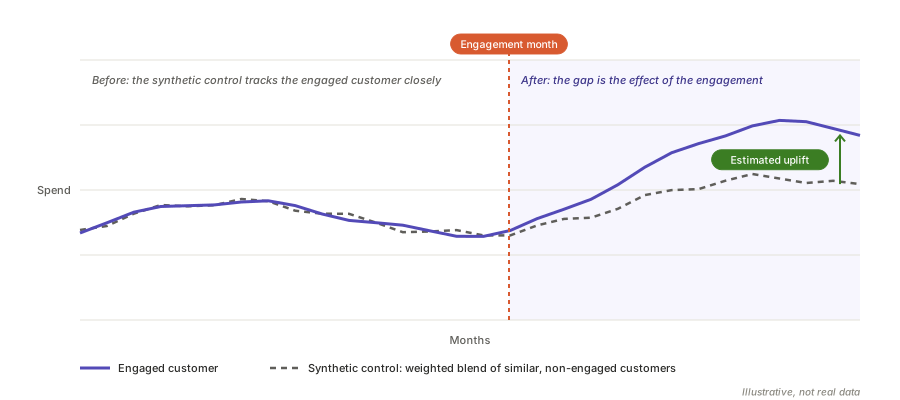
If the two lines match closely before the engagement, the synthetic control is a credible stand-in for “what would have happened anyway”. After the engagement, the gap between them is the estimated effect. It’s a quasi-experiment: no randomised trial, but a far fairer comparison than before-and-after alone.
In practice, the model often found a single close match. When it couldn’t, it returned several controls with weights summing to one.
Finding controls for every customer, every month
Doing this for one customer in a notebook is easy. Doing it for every engaged customer, every month, with no one hand-tuning the results, is where the work was.
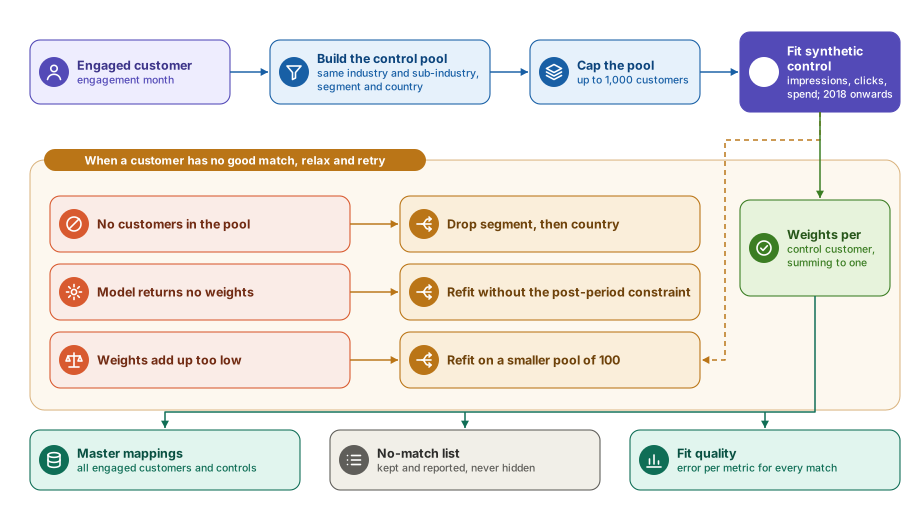
Start with a tight, like-for-like pool. Candidates had to share the engaged customer’s industry and sub-industry, segment and country, and must not have been engaged themselves. Matching used monthly impressions, clicks and spend, with history going back to 2018.
Cap the pool. Some pools ran to many thousands of customers, which made the optimisation slow and unstable. Capping the pool at 1,000 kept it fast without losing good matches.
Relax and retry, by rule. Real data doesn’t always cooperate, so the pipeline had explicit fallbacks:
- No customers in the pool: drop the segment filter and retry; if that’s still empty, drop the country too.
- The model returns no weights: refit without the post-period constraint.
- The weights add up too low (a weak match): refit on a smaller pool of 100 closest candidates.
Every retry was logged with the filters that were relaxed, so anyone could see how strict each match was. Customers with no credible match even after retries went into a separate list. They were reported, never silently dropped.
Record fit quality. For every match, the pipeline kept the error between the engaged customer and its synthetic control on each metric, so weak matches could be spotted and discounted.
From a model to a monthly report
The analysis only mattered if the teams could see it every month without asking anyone. So the whole process became a scheduled pipeline on Databricks, orchestrated by Azure Data Factory, feeding a Power BI report.
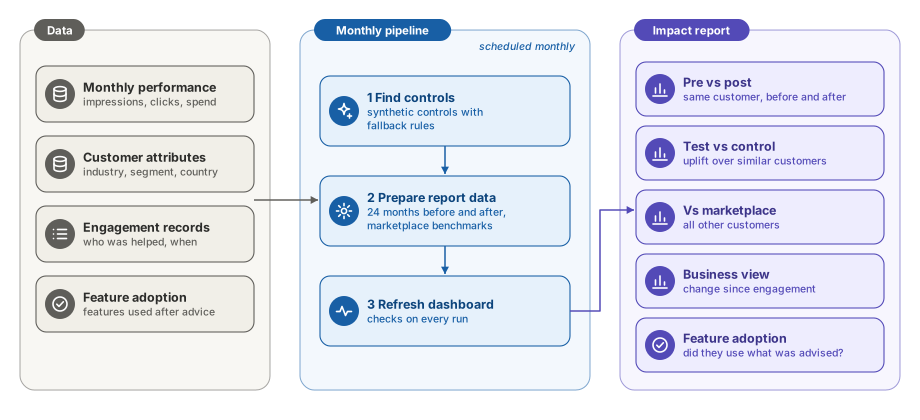
On the fourth of each month:
- Find controls for the previous month’s engaged customers, and append them to a master mapping file that goes back to the start of the programme.
- Prepare the report data: revenue and spend for each engaged customer and its controls, for 24 months before and after the engagement.
- Refresh the dashboard, with checks on every pipeline run and every refresh.
The report answered the same question from five angles:
- Pre vs post: the same customer’s average spend before and after engagement, over equal windows (capped at six months, when a customer is considered to have “matured”).
- Test vs control: the uplift of engaged customers compared with the uplift of their synthetic controls. This is the headline number.
- Versus the marketplace: engaged customers against everyone else. Recently engaged customers (within six months) are excluded from the marketplace figures, so they don’t contaminate the benchmark.
- Business view: the change in revenue from the engagement month to the last completed month, with year-on-year and two-year growth.
- Feature adoption: did customers actually adopt the features they were advised to use?
That last view closed the loop. A spend uplift is more convincing when you can also see that the customer started using the thing you recommended.
Lessons learned
- The counterfactual is the whole game. Before-and-after comparisons answer the wrong question. A credible “what would have happened anyway” is what makes an impact number defensible.
- Write the fallbacks down as rules. Synthetic controls fail in predictable ways: empty pools, no weights, weak matches. Encoding the retries as explicit rules, and logging which ones fired, made the results reproducible and trustworthy.
- Report what you couldn’t measure. Keeping a visible list of customers with no credible control did more for trust than any accuracy metric.
- Benchmarks need clean boundaries. Excluding recently engaged customers from the marketplace figures sounds like a detail. Without it, the benchmark slowly absorbs the effect you’re trying to measure.
- Automation is part of the method. A causal analysis that needs a data scientist every month doesn’t survive. Making it a scheduled pipeline is what turned a one-off study into something teams used to plan their work.
The takeaway
Synthetic controls turned “we think our advice helps” into a measured, monthly answer: for each engaged customer, how much better did they do than a fair stand-in that didn’t get the advice? The method itself is a few lines of code. The value came from making it robust and automated, and honest about the cases it couldn’t handle.
If you’re measuring the impact of human interventions, I’d love to compare notes. Find me on LinkedIn.