Every product with a feedback box collects thousands of short, angry, misspelled comments a month. Somebody needs to know which ones are about what. Routing them by hand doesn’t scale, so the natural move is a classifier.
This post is about building one for a consumer web product at a large online platform: sorting free-text user feedback into a handful of categories so each could reach the right team. The modelling was conventional. The lessons came from what a human review of the results showed, which is why I think it’s worth writing up.
The data: one category is almost everything
Each piece of feedback was a short sentence or two, translated to English where needed. It fell into four categories:
- Result quality: the answer or result wasn’t what the user wanted
- Partner quality: complaints about how the product reached the user’s device through partner distribution
- Browser prompts: complaints about prompts and pop-ups
- Unknown: everything else
The labelled training set looked like this:
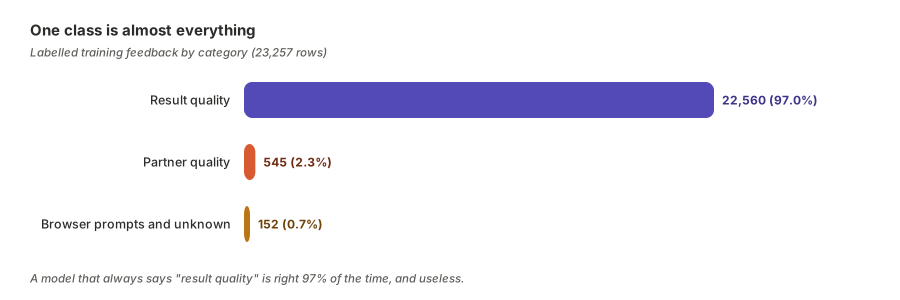
A model that always answers “result quality” is right 97% of the time, and tells you nothing. The categories the business cared most about were the small ones.
What we tried
We set up a grid of experiments rather than betting on one approach:
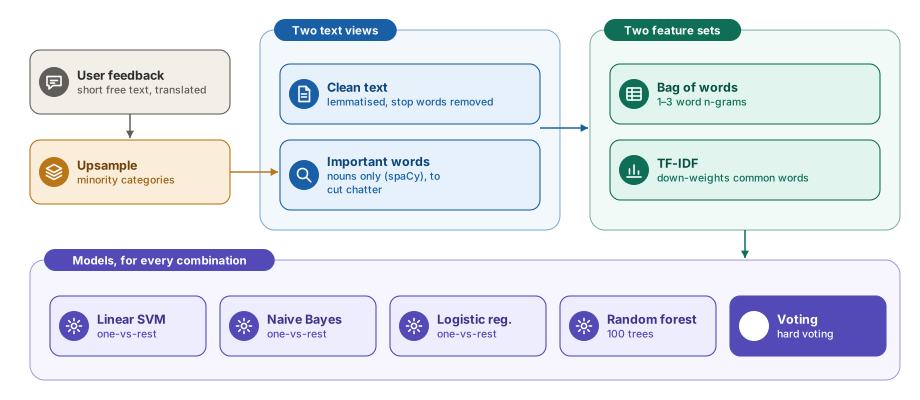
- Upsampling. Minority categories were upsampled in the training data so the models saw them often enough to learn something.
- Two text views. Clean text (lowercased, stop words removed, lemmatised), and important words, keeping only the nouns identified by spaCy, to cut the emotional chatter that dominates this kind of feedback.
- Two feature sets. A bag of words with one- to three-word n-grams, and TF-IDF.
- Five model families. Linear SVM, multinomial Naive Bayes and logistic regression (each one-vs-rest), random forests, and hard-voting ensembles of the best of them.
That’s around 20 combinations, all trained on about 23,000 labelled examples and tested on about 7,700 held-out ones, in Databricks.
The business also supplied seed phrases for each category: “this is not what I was looking for”, “why is this on my computer?” and so on. Counting how often they appeared in the real data was revealing. Most of the seed phrases never appeared verbatim. Users don’t write the sentences we imagine them writing; single words like “wrong” and “looking for” carried far more signal.
What the human review showed
Offline metrics looked fine. To check, the business reviewed a random sample of 2,000 predictions from two months of live feedback.
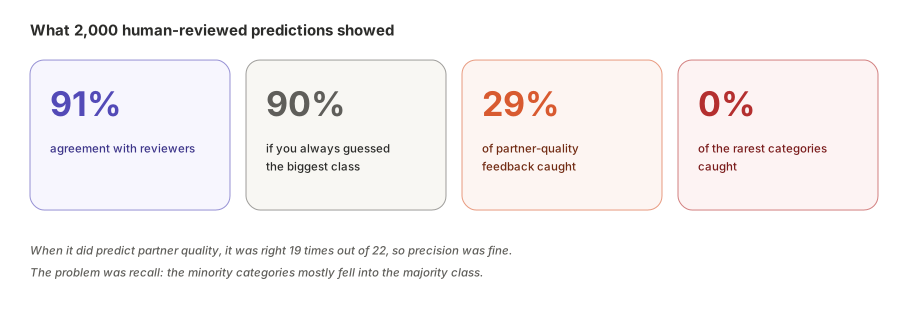
- 91% agreement with the reviewers sounds good, until you notice that always guessing the biggest class would have scored about 90% on the same sample.
- Partner quality: the model caught only 19 of the 66 that reviewers found, a recall of 29%. But when it did predict partner quality, it was right 19 times out of 22, so precision was fine.
- Unknown and browser prompts: reviewers found 129 of these, and the model caught none. All of them were filed as result quality.
In other words, upsampling and model choice had nudged the minority classes, but not nearly enough. The model was precise and timid: right when it spoke up, but rarely speaking up.
Lessons learned
- Accuracy is the wrong headline for imbalanced data. Report per-class recall and precision, and always show the majority-class baseline next to any accuracy number.
- Review a random live sample early. The 2,000-item review told us more in a week than months of offline metrics, because it measured what users actually wrote, with the real class mix.
- Seed phrases aren’t data. Business intuition about how users talk is a useful starting point, but it has to be checked against the real text.
- Upsampling isn’t a cure. Duplicating a few hundred examples doesn’t add new ways of saying things. More labelled minority examples, class weights and threshold tuning per class would have helped more.
- Consider a two-stage design. A first model that only asks “is this result quality or not?”, followed by a second that splits the rest, would have given the small categories a fairer chance.
How I’d do it today
Today I’d start with an LLM, prompted with clear category definitions and a few examples, to label a few thousand items. Then I’d either use it directly or use its labels to train a small, cheap classifier, with per-class recall as the metric from day one and a human review of a random sample before anyone relies on it. The classical models weren’t the problem here. The way we measured success was.
The takeaway
When one class is 97% of your data, a good accuracy number is easy and meaningless. What made this project valuable was the human review that exposed it: a precise but timid model, strong on the class that didn’t need help and blind to the ones that did. Measure per class, against a baseline, on real data, as early as you can.
If you’re classifying messy, imbalanced text, I’d love to compare notes. Find me on LinkedIn.